The VIX is a measure of market volatility. It's often called the "fear index" because it spikes when investors are scared and falls when they're not.
When the VIX spikes, it's usually because something has happened to make investors nervous. Maybe a war has broken out, a natural disaster, or more recently, interest rate hikes.
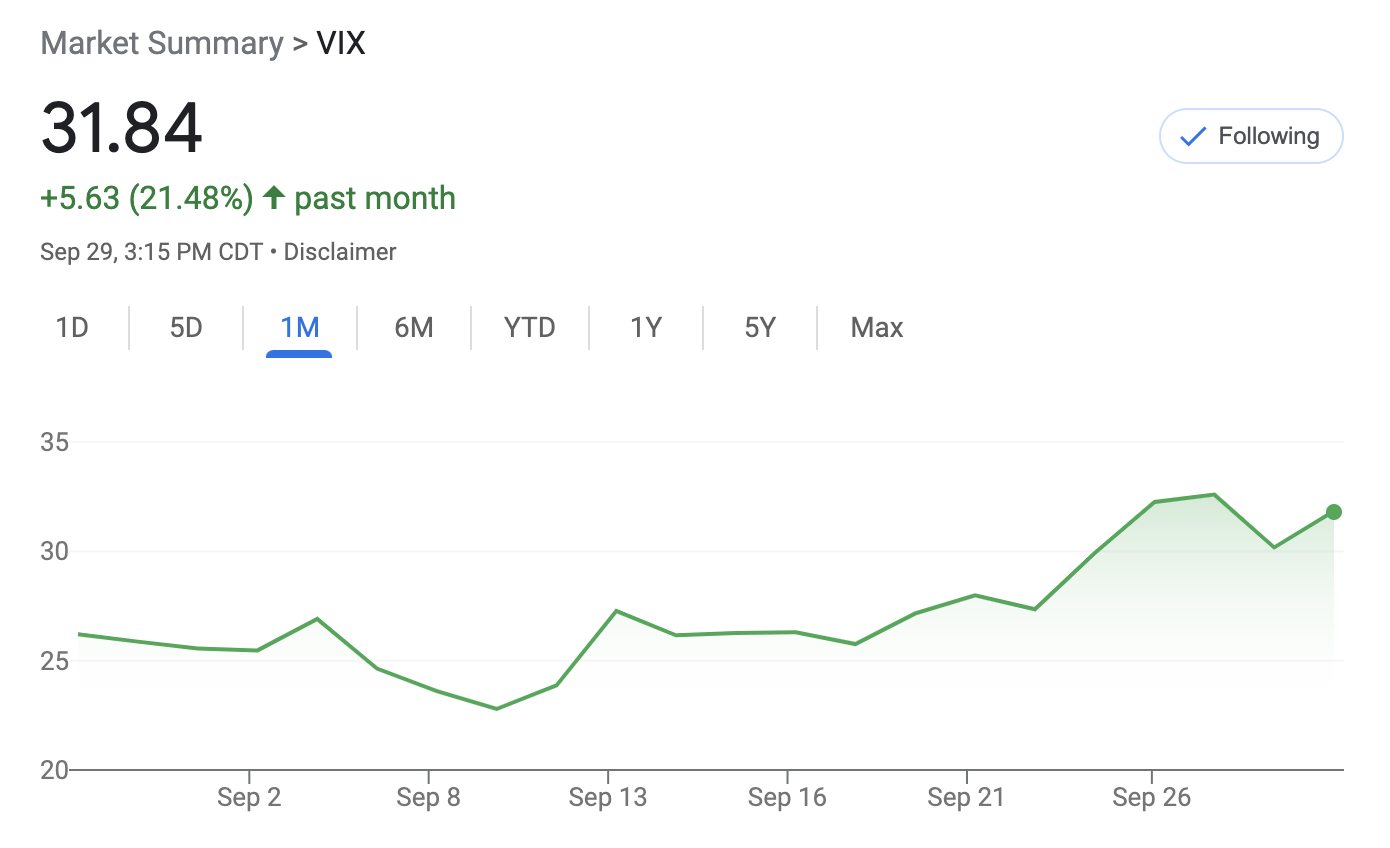
As of writing this article, the VIX is up 25%+ in the last month.
When investors get scared, they tend to sell stocks and buy safe havens like government bonds.
In other words, when the VIX is rising, stocks are typically falling.
The past month fits this pattern.
*The S&P 500 is a stock market index that measures the performance of 500 large publicly traded companies.
In 2020, a research paper examined using the VIX as a buy/sell signal to see if it could enable investors to generate above-average returns.
The theory behind the paper is that when the VIX spikes above average, market prices are probably low and it may be time to buy.
Conversely, when the VIX drops below average, market prices are probably high, and it may be time to sell.
The paper concluded that, at least historically, this was in fact true.
The average level of the VIX has historically been around 19.5
The average performance of the S&P 500 after 6 months of the VIX reaching above 30 was 13.4%.
Twelve months after a VIX of 30 or higher, the index had an average return of 23.4%.
That's nearly triple the average return for the S&P 500 of 8.4%.
The table below shows the 500 trading day returns by sector after the VIX reaches certain levels.

I don’t know what you decide to do with this information but for me, as a long-term investor, this gives me reassurance to continue to buy quality companies while history is on my side.
Leave a Reply